Building a Financial App: Strategic Framework & Implementation Roadmap
Executive Summary
Building a financial app requires a structured approach across three critical dimensions: market positioning, technical architecture, and regulatory compliance. The financial app market is experiencing explosive growth, with mobile banking adoption reaching 89% globally and fintech investment exceeding $210B annually. Success depends on identifying your specific market segment (wealth management, lending, payments, budgeting, or investment), understanding competitive dynamics, and establishing a differentiated value proposition that addresses genuine user pain points.
This analysis provides a comprehensive framework for evaluating financial app opportunities, assessing competitive positioning, and defining a go-to-market strategy.
Market Landscape & Opportunity Assessment
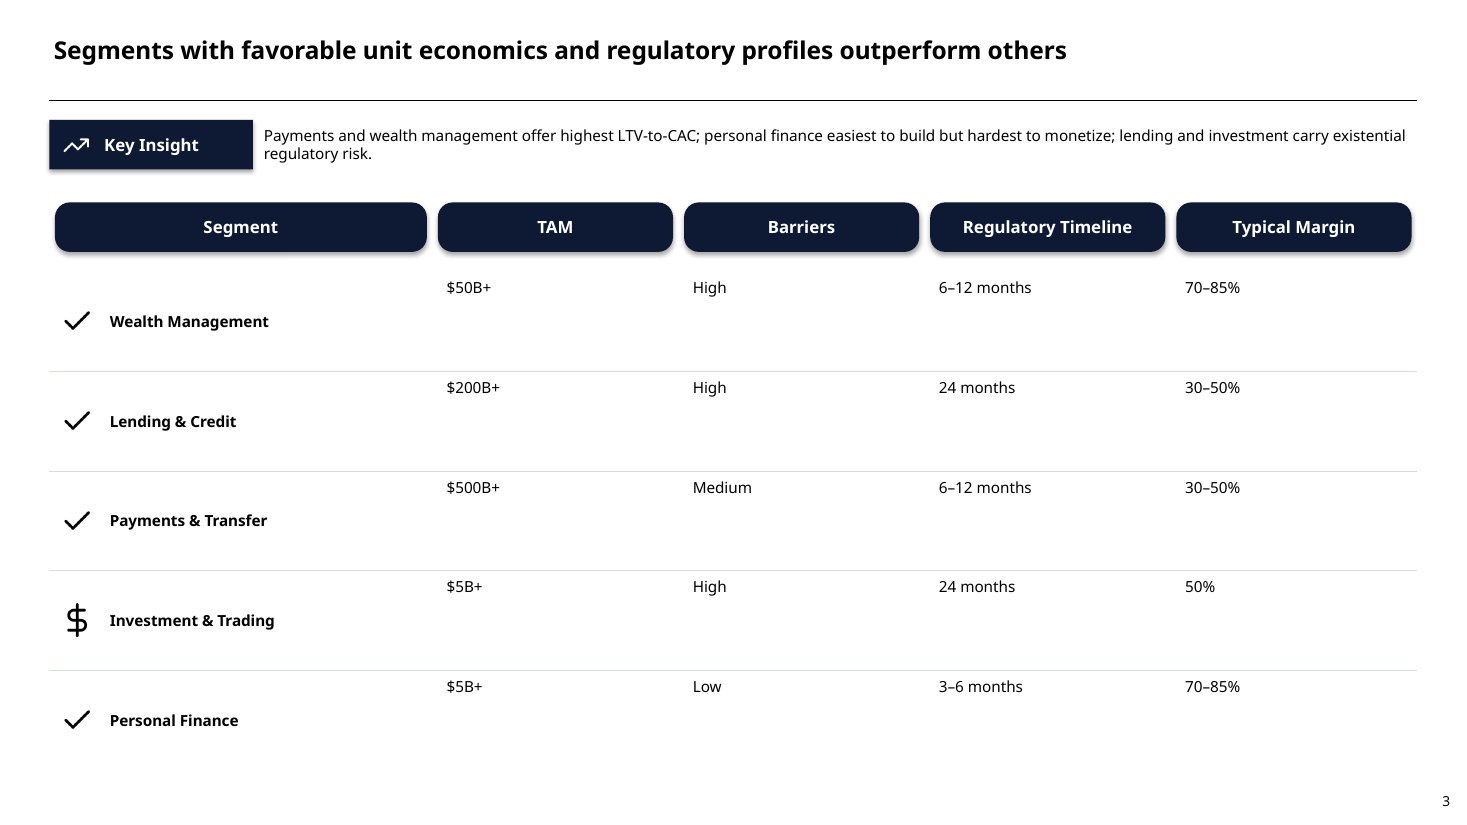
| Segment | Primary Users | Key Competitors | Growth Driver | Regulatory Burden |
|---|---|---|---|---|
| Wealth Management | High-net-worth individuals, advisors | Wealthfront, Betterment, Personal Capital | Robo-advisory adoption, automation | High (SEC, FINRA) |
| Lending & Credit | Underserved borrowers, SMEs | Affirm, Upstart, LendingClub | Alternative credit scoring, speed | Very High (CFPB, state regulators) |
| Payments & Transfer | Consumers, gig workers, immigrants | Stripe, PayPal, Square, Wise | Instant settlement, global reach | High (FinCEN, state money transmitter) |
| Investment & Trading | Retail investors, active traders | Robinhood, E-Trade, Charles Schwab | Fractional shares, zero commissions | Very High (SEC, FINRA, exchanges) |
| Personal Finance & Budgeting | Mass market, Gen Z, millennials | Mint (acquired), YNAB, Rocket Money | Behavioral insights, gamification | Low (consumer protection) |
Competitive Positioning Framework
Financial App Market: User Acquisition Cost vs. Customer Lifetime Value by Segment
Core Strategic Decisions: Define Your Positioning
1. Market Segment Selection
Choose based on three criteria:
Addressable Market Size — Total revenue opportunity in your chosen segment
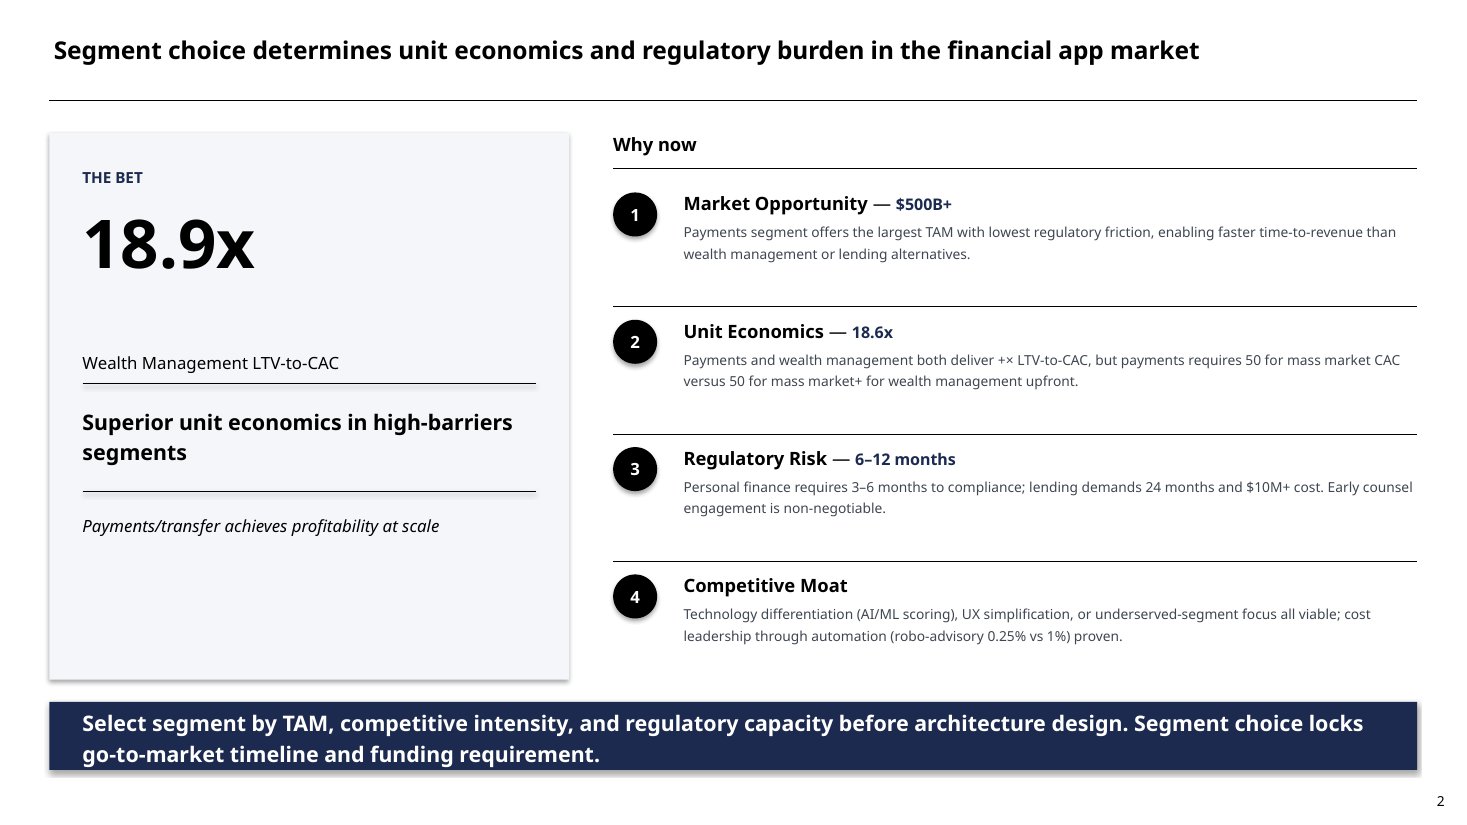
- •Wealth management: $50B+ global TAM (advisory fees, AUM percentage)
- •Lending: $200B+ global TAM (origination volume, spreads)
- •Payments: $500B+ global TAM (transaction fees, spreads)
- •Personal finance: $5B+ TAM (freemium upsell, premium subscriptions)
Competitive Intensity — Barriers to entry and incumbent strength
- •High barriers: Investment trading (exchange licensing, regulatory capital), lending (credit scoring, loan origination platforms)
- •Medium barriers: Payments (network effects, compliance), wealth management (regulatory requirements, trust)
- •Low barriers: Personal finance & budgeting (easy to build, hard to monetize)
Regulatory Complexity — Time and cost to achieve compliance
- •Very high: Lending, investment, money transmission (12–24 months, $2M–$10M+)
- •High: Wealth management, advisory (6–12 months, $500K–$2M)
- •Low: Personal finance aggregation (3–6 months, $50K–$200K)
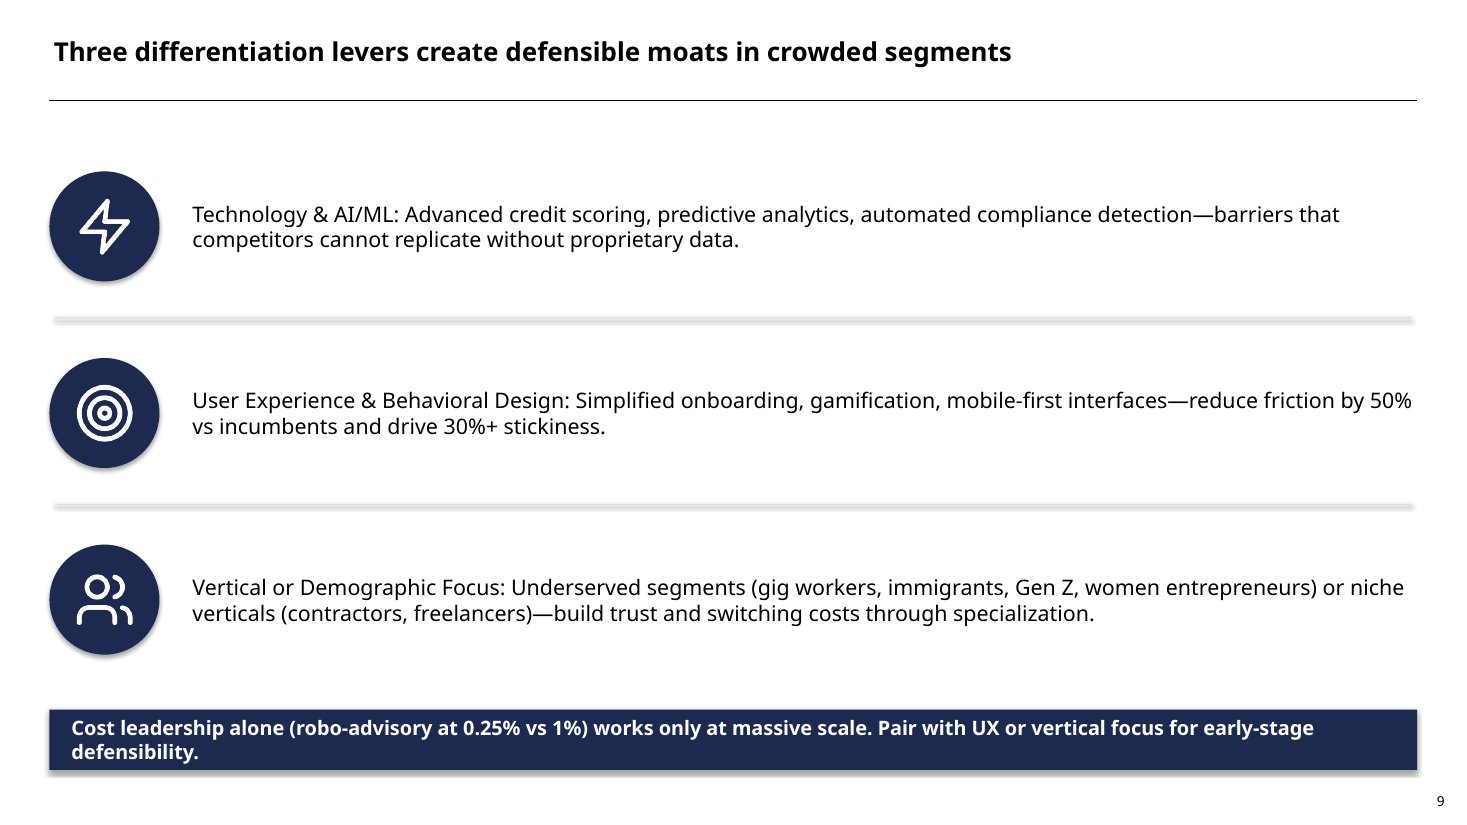
2. Differentiation Strategy: Your Competitive Moat
Identify what makes your app defensible:
Technology & AI/ML
- •Advanced credit scoring or underwriting (alternative data, behavioral signals)
- •Predictive analytics for portfolio optimization or spending patterns
- •Automated compliance and fraud detection
User Experience & Behavioral Design
- •Simplified onboarding (reduce friction vs. incumbents)
- •Gamification and engagement mechanics (Robinhood's success with fractional shares + social)
- •Mobile-first or voice-first interfaces
Vertical or Demographic Focus
- •Underserved segments (gig workers, immigrants, Gen Z, women entrepreneurs)
- •Niche verticals (contractors, freelancers, small businesses)
- •Geographic expansion (emerging markets with limited banking infrastructure)
Cost Leadership & Pricing
- •Lower fees through automation (robo-advisory at 0.25% vs. 1%)
- •Freemium model with premium upsell (Rocket Money, YNAB)
- •Embedded finance within existing ecosystems (Stripe, Shopify)
Technical Architecture & Feature Roadmap
Financial App Technology Stack
Phase 1: MVP (Months 0–4)
- •User authentication and KYC (Know Your Customer)
- •Core feature set (1–2 primary use cases: e.g., account aggregation + budgeting, or simple investing)
- •Payment processing integration (Stripe, ACH)
- •Basic compliance and data security (encryption, PCI-DSS if handling cards)
Phase 2: Scale & Differentiation (Months 5–12)
- •Advanced analytics and AI-driven insights
- •API partnerships for data enrichment (Plaid for banking data, market data feeds)
- •Premium features and monetization (subscriptions, premium analytics, advisor access)
- •Enhanced compliance (SAR/CTR reporting, enhanced due diligence)
Phase 3: Ecosystem & Expansion (Months 12+)
- •White-label or embedded finance offerings
- •International expansion (multi-currency, local payment methods)
- •Strategic partnerships (banks, brokers, fintechs)
- •Regulatory licensing (money transmitter, investment advisor, lending)
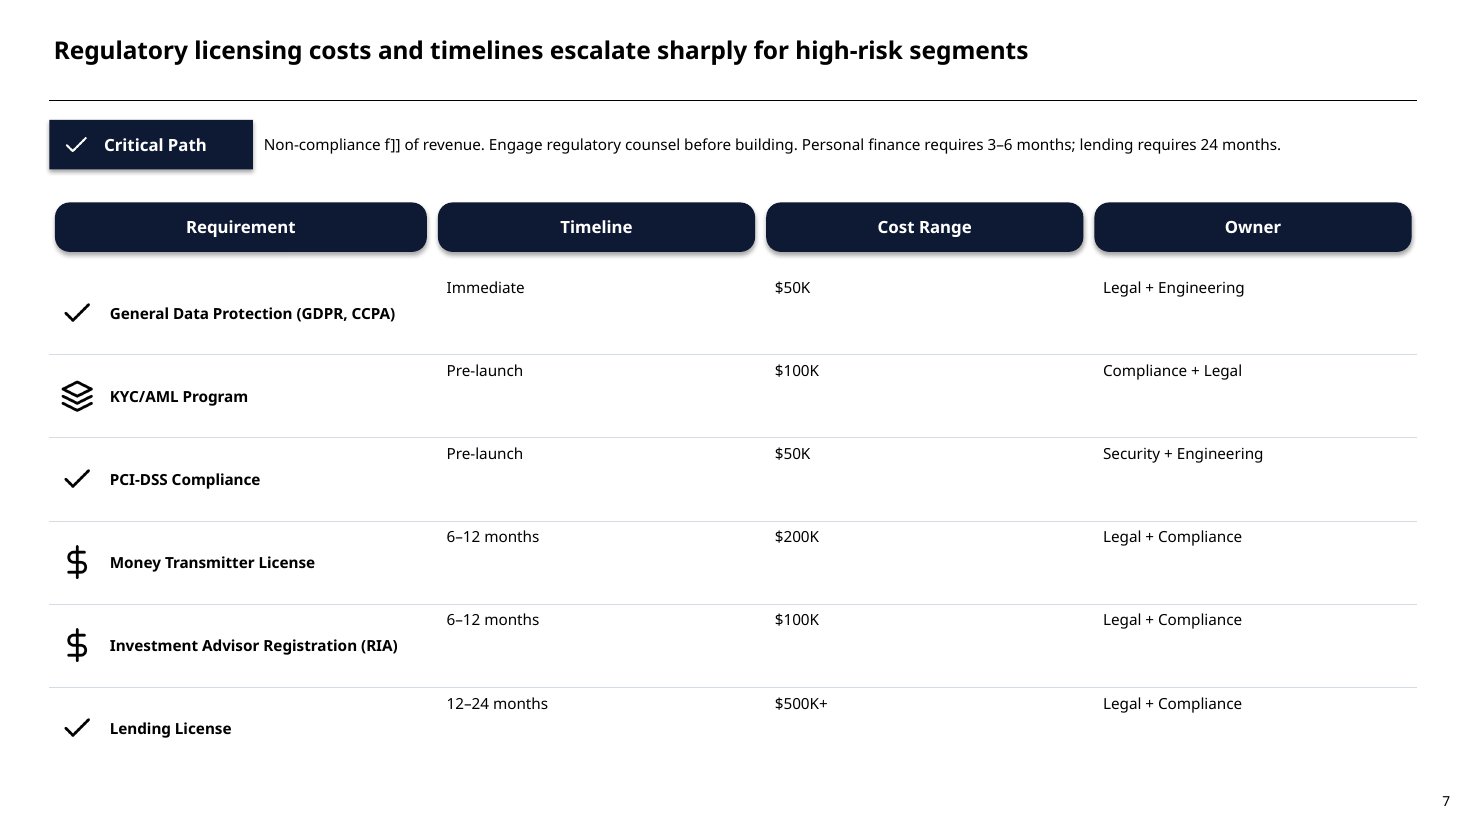
Regulatory & Compliance Roadmap
| Requirement | Timeline | Cost | Owner |
|---|---|---|---|
| General Data Protection (GDPR, CCPA) | Immediate | $50K–$150K | Legal + Engineering |
| KYC/AML Program | Pre-launch | $100K–$300K | Compliance + Legal |
| PCI-DSS Compliance (if handling cards) | Pre-launch | $50K–$200K | Security + Engineering |
| Money Transmitter License (if moving funds) | 6–12 months | $200K–$500K | Legal + Compliance |
| Investment Advisor Registration (RIA) (if managing assets) | 6–12 months | $100K–$300K | Legal + Compliance |
| Lending License (if originating loans) | 12–24 months | $500K–$2M+ | Legal + Compliance |
Go-to-Market Strategy & Unit Economics
Customer Acquisition Channels
Organic & Viral
- •Referral programs (incentivize existing users to invite friends)
- •Content marketing (blogs, financial education, YouTube tutorials)
- •SEO/SEM for financial keywords (high intent, but expensive: $2–$5 per click)
Partnerships
- •Banks and brokers (white-label or referral revenue share)
- •Employers (payroll integration, workplace benefits)
- •Financial advisors and CPAs (lead generation, integration)
Paid Acquisition
- •Social media advertising (Facebook, Instagram: $0.50–$2 CAC for mass market)
- •Influencer partnerships (especially for Gen Z/millennial segments)
- •Affiliate networks and comparison sites
Revenue Models
| Model | Best For | Typical Margin |
|---|---|---|
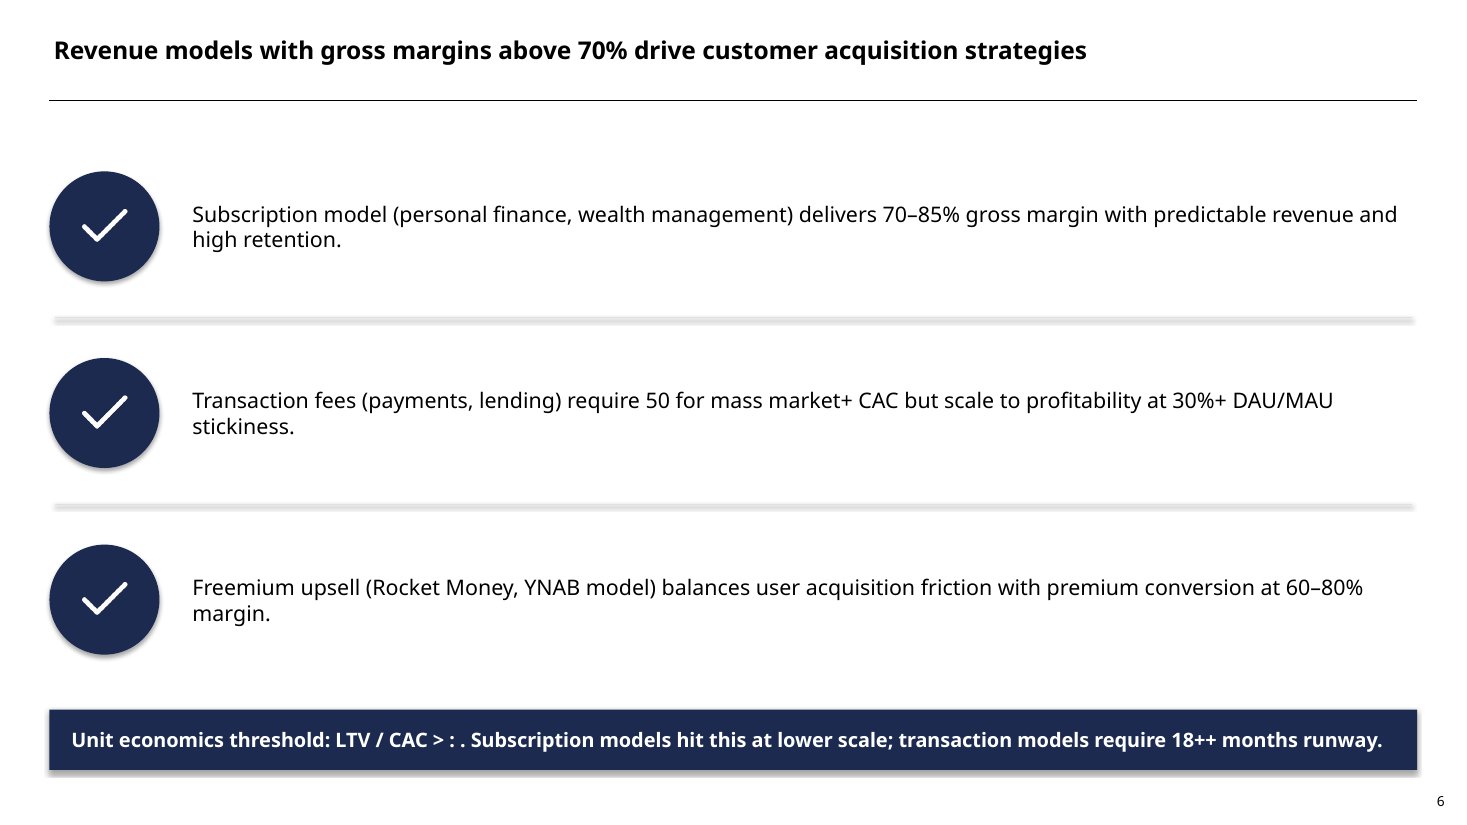
| Subscription (SaaS) | Personal finance, wealth management | 70–85% gross margin |
| Transaction Fees | Payments, lending, investing | 30–50% gross margin |
| Asset-Under-Management (AUM) % | Wealth management, robo-advisory | 40–60% gross margin |
| Lending Spread | Credit & lending products | 200–500 bps (basis points) |
| Freemium + Premium | Mass market consumer apps | 60–80% gross margin |
| B2B/White-Label | Enterprise, embedded finance | 50–70% gross margin |
Risk Assessment & Mitigation
| Risk | Probability | Impact | Mitigation |
|---|---|---|---|
| Regulatory enforcement / license denial | High (if financed lending/investment) | Existential | Engage counsel early; build compliance-first |
| Data breach / security incident | Medium | Very High | SOC 2 Type II; regular penetration testing; cyber insurance |
| Competitive pressure from incumbents | High | High | Focus on underserved segments; build defensible tech moat |
| Customer churn / low retention | High | Medium | Invest in onboarding UX; behavioral analytics; engagement loops |
| Scaling infrastructure costs | Medium | Medium | Use cloud-native architecture; optimize database queries; implement caching |
| Third-party API dependency | Medium | Medium | Diversify integrations; build fallback mechanisms; negotiate SLAs |
Success Metrics & KPIs
User Acquisition & Retention
- •Monthly Active Users (MAU) growth rate: Target 10–20% month-over-month
- •Customer Acquisition Cost (CAC): Target < $50 for mass market, < $500 for wealth management
- •Churn rate: Target < 5% monthly for subscription, < 10% for freemium
Engagement & Monetization
- •Daily Active Users (DAU) / MAU ratio: Target > 30% (indicates stickiness)
- •Average Revenue Per User (ARPU): Target $5–$50/month depending on segment
- •LTV / CAC ratio: Target > 3:1 (unit economics threshold)
Financial Health
- •Gross margin: Target 60%+ by year 2
- •Burn rate: Target break-even by month 18–24
- •Runway: Maintain 18+ months of cash runway
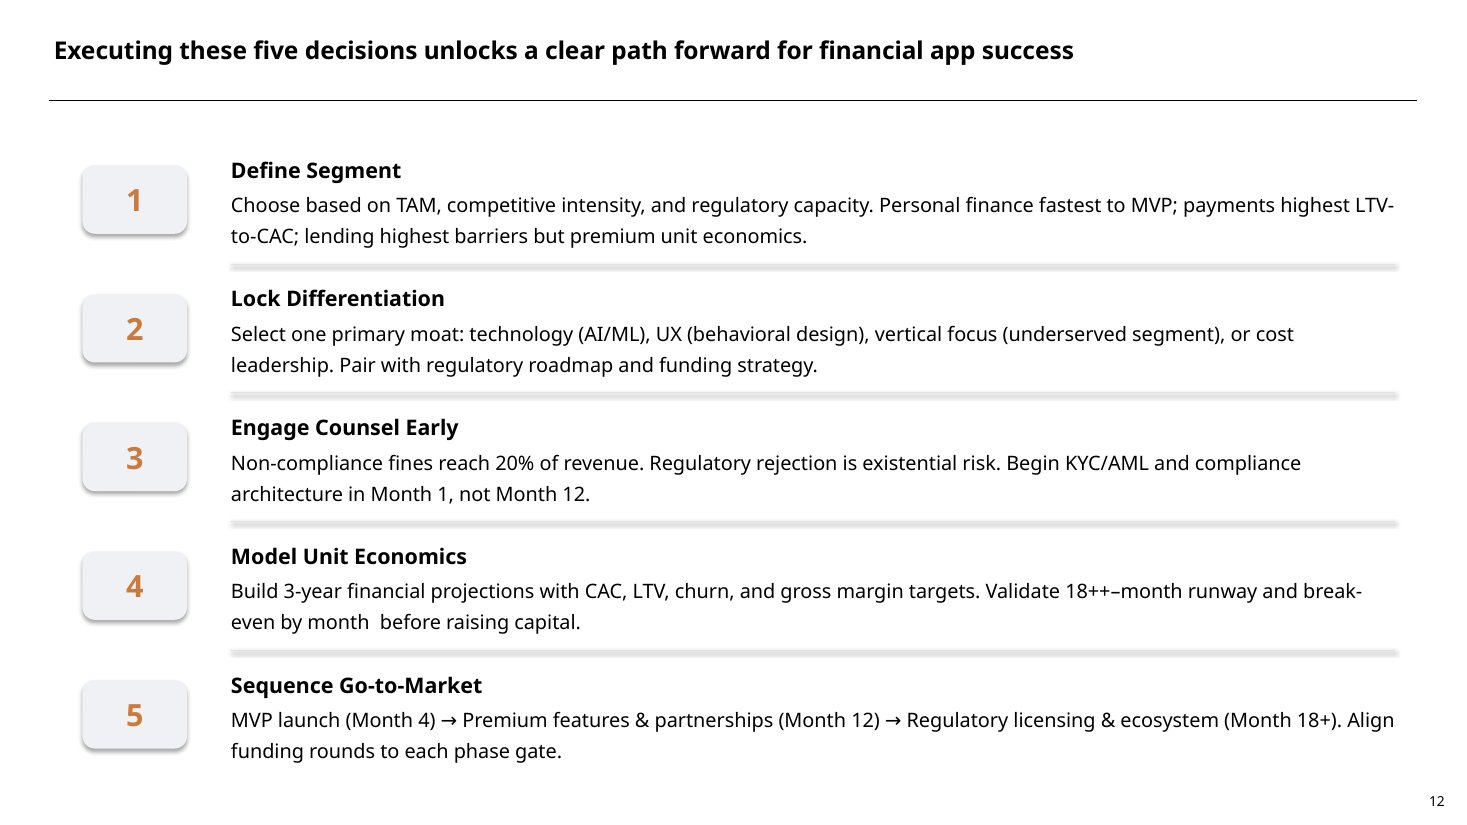
Key Decisions: Define Your Path Forward
Before building, answer these critical questions:
- 1Which market segment aligns with your expertise and capital?Wealth management requires trust; lending requires credit expertise; payments requires scale.
- 2What is your differentiation?Technology, UX, underserved segment, cost leadership, or ecosystem play?
- 3What is your regulatory path?Can you launch as a non-regulated app first, or do you need licensing upfront?
- 4What is your funding strategy?Bootstrapped, seed round, venture, or strategic partnership?
- 5What is your 3-year revenue target?Influences feature prioritization and go-to-market intensity.
Next Steps
Would you like me to:
- 1Develop a detailed feature roadmapDefine MVP scope, prioritization framework, and 12-month product timeline tailored to your chosen segment.
- 2Build a financial modelCreate 3-year P&L projections, unit economics analysis, and funding requirement scenarios based on your business model.
- 3Create a regulatory compliance checklistOutline specific licenses, filings, and timelines required for your financial app type and jurisdiction.
- 4Design a go-to-market strategyDevelop customer acquisition channels, pricing strategy, and launch playbook with specific metrics and milestones.
- 5Analyze competitive positioningDeep-dive into 3–5 direct competitors, identify market gaps, and define your differentiation strategy.